

Reading Analytics and Revenue Insights
The Author Panel has two reporting pages. Analytics gives you a long-range view of sales, customers and your top products. Revenue Insights focuses on a recent period, with conversion funnels and pricing suggestions. Both are in the sidebar.
The Analytics page
Open Analytics to reach the Analytics & Insights page. Each section shows an empty state with a short explanation until there is enough data to draw it.
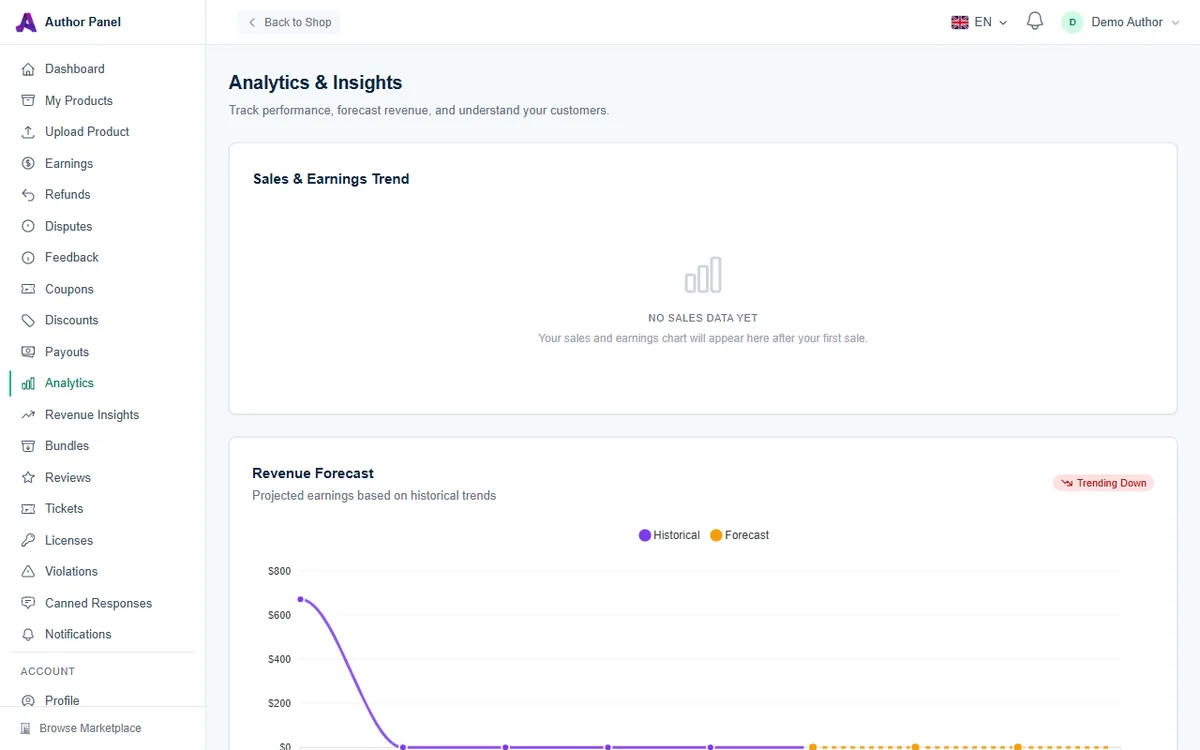
Sales & Earnings Trend
A daily chart of your sales count and net earnings over the last 30 days. It starts empty and fills in from your first sale. If your recent sales are older than 30 days, this chart can be empty even though you have earnings.
Revenue Forecast
Projects your earnings for the next three months from your monthly earnings over the past six months. The Historical line shows what you earned and the Forecast line shows the projection. A badge sums up the direction: Trending Up, Stable or Trending Down. Treat it as a rough guide. It is a simple trend line, so a single big month can swing it.
Sales Heatmap
Shows when your products sell the most, by day of the week and hour. Use it to time releases, announcements and the start of discounts.
Customer Insights and Top Buyer Countries
- Total Unique Buyers: how many different customers have bought from you.
- Repeat Buyers: customers who bought more than once, with the percentage of your buyers this represents.
- Average Review Rating across your products.
- Conversion Rate: completed sales divided by the total views of your products.
- Top Buyer Countries: where your customers come from.
Top Products
A table of your best sellers with their Sales, Revenue and Rating. Click a product name to open it in My Products.
The Revenue Insights page
Open Revenue Insights and choose a period from the dropdown at the top right: Last 7 days, Last 30 days (the default) or Last 90 days.
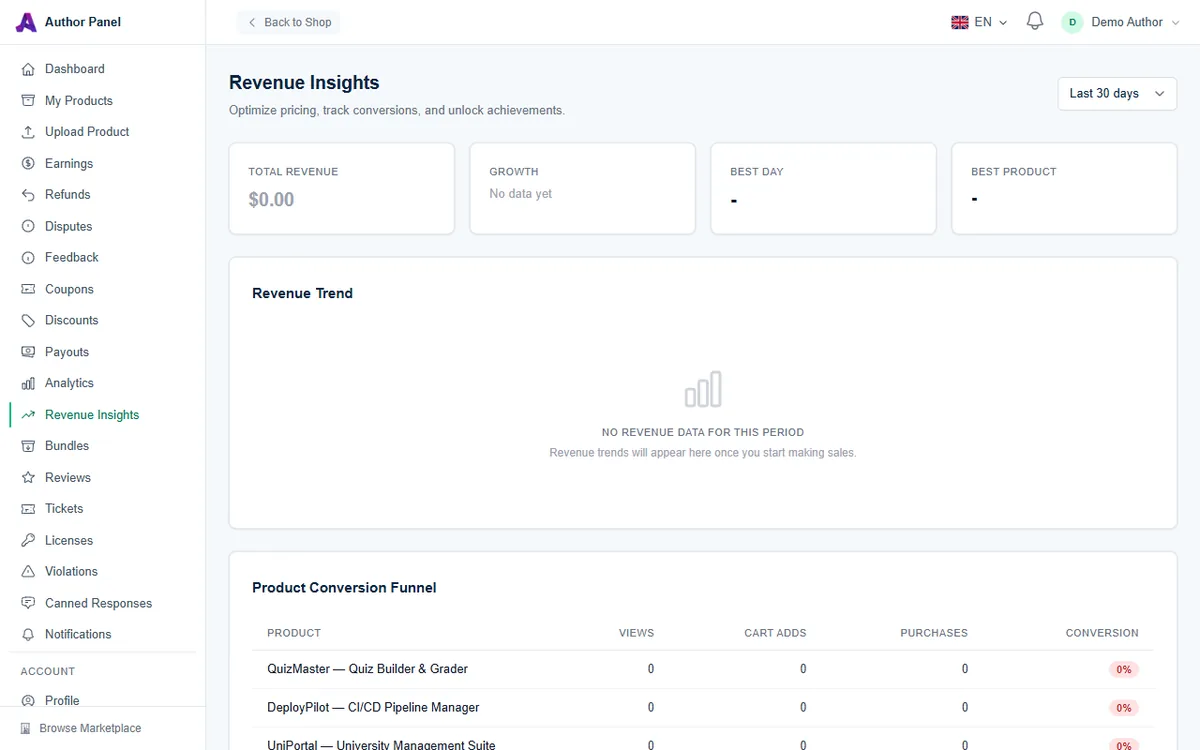
Summary cards
- Total Revenue: your net earnings in the period, after the platform fee.
- Growth: the change compared with the previous period of the same length. It reads No data yet until there is something to compare.
- Best Day: the date with the highest earnings in the period.
- Best Product: the product that earned the most in the period.
Revenue Trend
A day-by-day chart of your earnings for the selected period.
Product Conversion Funnel
Your ten best-selling products, each with Views, Cart Adds, Purchases and Conversion. Cart Adds and Purchases count the selected period, and refunded purchases are left out. Views is the product's all-time view count, so read Conversion as a broad indicator rather than an exact rate for the period. A product with many views but few cart adds may need a clearer description, better screenshots or a demo.
Price Optimization Suggestions
For each paid product in the list, this section compares Your Price with the Category Avg and Category Median of other paid products in the same category, and shows a Suggested Range. It's a starting point, not a rule. Weigh it against your features, support and reviews.
Achievements
Milestones you unlock as you grow: First Sale, 100 Sales, 500 Sales, 1,000 Sales, $1K Revenue, $10K Revenue, $50K Revenue, 1 Year Anniversary, 2 Year Anniversary and Top Seller of the Month. Milestones you haven't reached yet are marked Locked. Earned ones get a check mark.
Which page should I use?
- For exact amounts, statuses and exports, use Earnings. See Understanding Payouts.
- For long-term trends and who your customers are, use Analytics.
- For the last week, month or quarter, and for listing and pricing decisions, use Revenue Insights.
Frequently asked questions
Why do the charts say there's no data when I have sales?
The trend charts only cover a recent window: the last 30 days on Analytics, and the selected period on Revenue Insights. Older sales still appear on the Earnings page.
Are these figures before or after fees?
Earnings-based figures, such as the trend charts, Total Revenue and Best Product, use your net earnings after the platform fee. For the per-sale breakdown, check the Earnings page.
Related articles
Was this article helpful?